
As one of the world’s most important financial hubs, London offers plenty of potential for traders seeking an alternative to US equities. To understand and access the London stock market, investors can refer to the FTSE 100, which is the prime benchmark for the UK economy at large.
In this article, we’ll discuss the characteristics of the FTSE 100, how to trade the index using CFDs, and different trading strategies to consider.
Key Points
- The FTSE 100 Index, also known as “the Footsie,” tracks the 100 largest companies on the London Stock Exchange.
- Investors can trade the FTSE 100 via CFDs (Contracts-for-Difference) to potentially make returns from UK market movements without the underlying asset.
- The FTSE 100 offers diverse sector exposure and is considered a low-cost investment option compared to other global indices.
What is the FTSE 100? [1]
The Financial Times-Stock Exchange 100 Share Index (FTSE 100) tracks the 100 largest companies by market capitalisation that are listed on the London stock exchange. Amusingly, it is also commonly referred to as “the Footsie”.
Launched in 1984, the FTSE 100 is owned and maintained by the London Stock Exchange Group. It holds similar importance as the S&P 500 or Dow Jones Industrial Average, serving as a major indicator for the performance of the broader UK economy.
The index is derived using the total market capitalisation of all 100 constituents. It is calculated continuously every trading day from 8am to 4.30pm, As the share prices of constituents move up and down throughout the day, so does the level of the index.
FTSE levels are measured against the previous day’s market close. When the index closes the day up, it means the total value of all the 100 companies tracked increased. When the index closes the day down, it means the total value of the 100 companies tracked decreased – this is most likely to be from the largest companies in the benchmark.
Composition and trading hours
Top 10 constituents of the FTSE 100 Index [2]
At the time of writing, the top 10 constituents of the FTSE 100 are shown in the following table.
Note that index constituents need not be UK companies, but must be listed on the London stock exchange. The market capitalisation of the 7th and 8th ranked companies are listed in their home currency.
| Company | Market cap (GBP) |
| Astrazeneca PLC | 191.26 billion |
| Shell PLC | 186.00 billion |
| HSBC Holdings PLC | 132.62 billion |
| Unilever PLC | 107.41 billion |
| BP PLC | 84.67 billion |
| GSK PLC | 74.75 billion |
| Rio Tinto PLC | 179.78 billion (AUD) |
| Relx PLC | 80.05 billion (USD) |
| Diageo PLC | 63.31 billion |
| Glencore PLC | 59.19 billion |
Trading hours of the FTSE 100 Index [3]
The FTSE follows the trading hours of the London Stock Exchange.
- Mondays to Fridays
- 8.00 am to 4.30 pm
- Extended trading hours
- Pre-market: 5.05 am to 7.50 am
- After hours: 4:40 pm to 5.15 pm
The exchange is closed on Saturdays and Sundays, as well as national holidays, as follows:
- New Year’s Eve and Day
- Good Friday
- Easter
- Bank Holiday (x 3)
- Christmas Eve and Day
- Boxing Day
Why trade the FTSE 100 Index?
The FTSE 100 index allows investors to gain exposure to the UK stock market, including some of the most well-established companies in the world.
The index is anchored by industry giants with centuries of history, and is well diversified across multiple sectors ranging from financial to utilities, consumer goods, pharmaceutical, defence, insurance and many more.
Among its eclectic constituent list are several internationally recognised brands, such as Prudential, Rolls-Royce, International Hotels Group, Experian and Tesco.
Besides its diversified offerings, another reason to trade the FTSE is its low price. A Morgan Stanley analysis report published in July 2023 concluded that core UK plc assets — equities and corporate bonds — “are arguably the cheapest asset classes in the world” then [4].
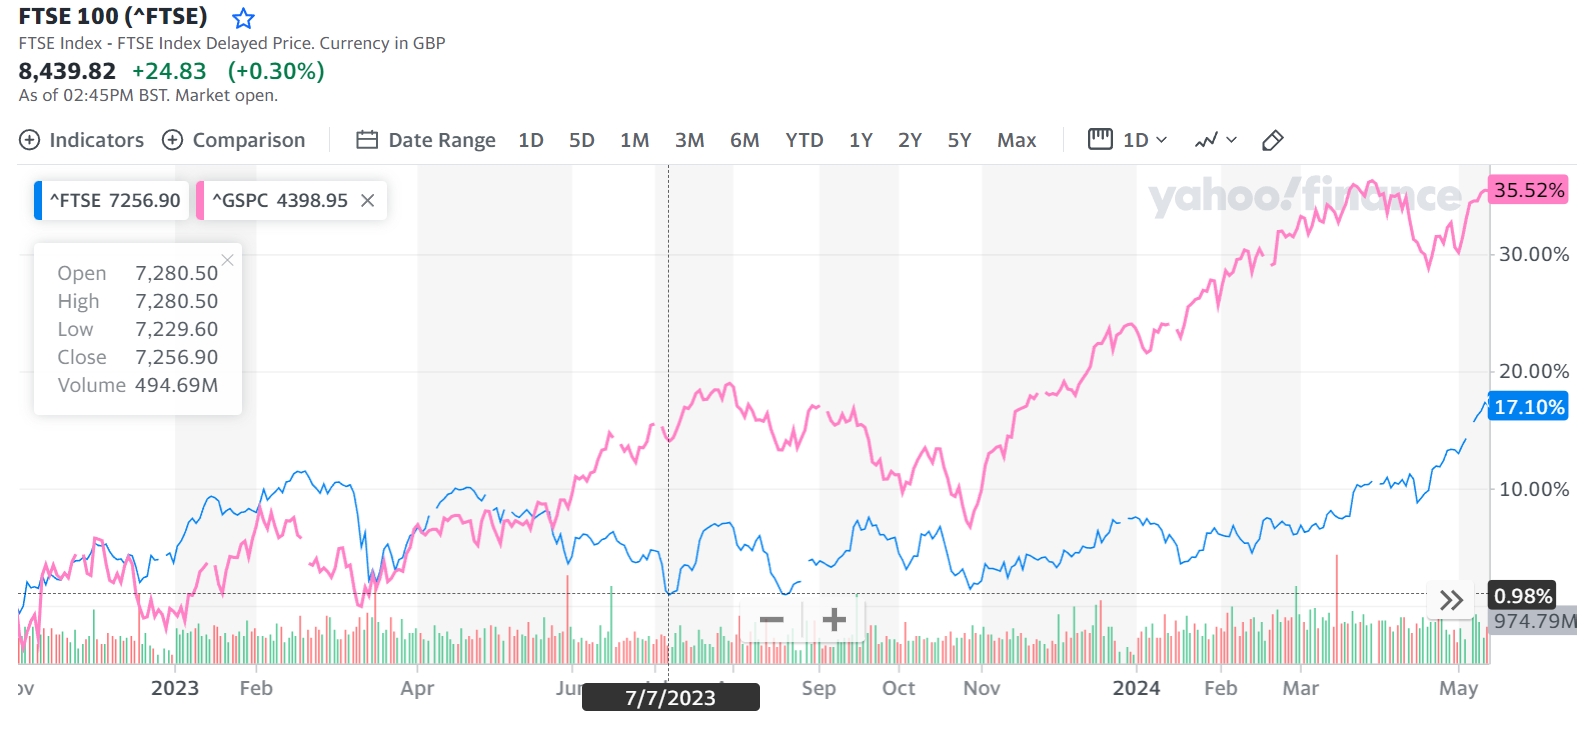
Judging by the large divergence between the S&P 500 (pink line) and the FTSE 100 (blue line) this sentiment is still valid as at May 2024.
Historical trends of the FTSE 100 Index [5]
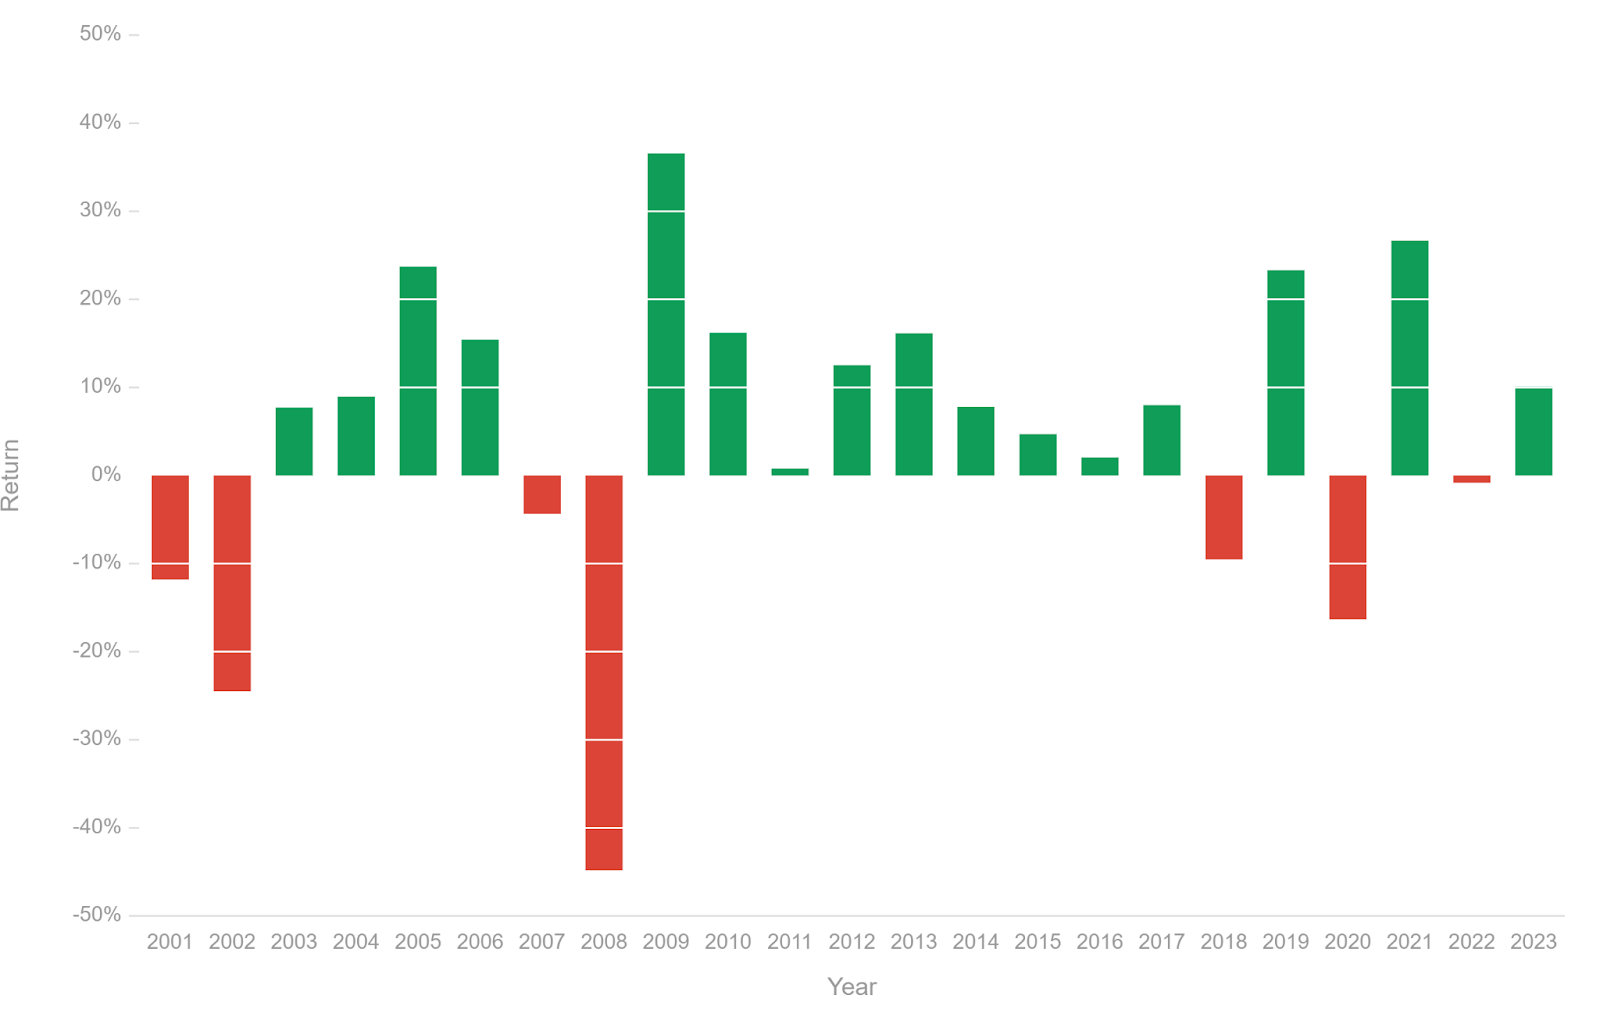
The chart above shows the yearly returns of the FTSE 100 Index from 2001 to 2023. Like many of its peers, the FTSE 100 suffered crashes during global economic crises – the dot.com bubble at the turn of the millennia; the subprime mortgage crisis in 2008; the 2018 global recession, and the COVID-19 pandemic in 2020.
Notably, during the 2022 stock market decline – sparked off by high inflation, Russia’s invasion of Ukraine and US Fed interest rate hikes – the FTSE 100 managed to stay relatively flat, ending the year down by only 0.84%. This was in contrast to the S&P 500, which fell by 19.4% in 2022, marking one of its worst years in decades [6].
How to trade the FTSE 100 Index with CFD
Being an index, the FTSE 100 cannot be directly invested or traded. However, investors looking to benefit from price action in the UK stock market can do so via Vantage CFDs (Contracts-for-Difference).
CFDs are financial derivatives that allow speculation in an underlying instrument, in this case, the FTSE. There is no direct ownership involved, only the price action is traded.
Here’s a simple explanation of how trading the FTSE using CFDs works: You open a trade by choosing whether the index will go up or down. If the price goes with your position, you make a profit. If it goes against your position, you will incur a loss.
At the close of the contract, the difference in the price of the index is settled directly in your account.
Why trade FTSE Index with CFDs?
Trading the FTSE via CFDs offers multiple advantages over other methods such as buying and selling FTSE fund shares.
For one, you can trade CFDs using leverage, which will amplify your gains if the index moves as you expected. However, leverage will also increase your losses if you made the wrong bet and the index moves against you instead. Leverage should be used with caution.
Secondly, with CFDs, you can take both long and short positions, allowing you to potentially benefit from the FTSE whether it goes up or down. This means there’s more opportunities for potential profit.
Thirdly, CFDs have a comparatively lower barrier to entry. You can start trading the FTSE with lesser capital, compared to buying shares of a FTSE index fund.
Analysing the FTSE Index market
Fundamental analysis
Because the FTSE tracks the performance of the broader UK markets, investors should build an understanding of the political and business landscape of the Eurozone. Here’s a few pointers when performing fundamental analysis on the FTSE Index.
Economic data
Economic data such as GDP, interest rates and inflation levels are important signallers of the UK economy, and can have significant impact on the FTSE.
In May 2024, signs of easing inflation and hopes of early interest rate cuts by the Bank of England helped boost the FTSE 100 to new record highs. This was no doubt helped by low asset prices [7].
Corporate earnings
The FTSE is sensitive to earnings reports, especially those of top-ranking constituents that have substantial influence over the index. Hence, it is important to keep track of earnings announcements and their expected impact on share prices.
Industry trends
As the FTSE tracks some of the biggest household names that have the ability to usher in new industry trends and standards, it is useful to keep an eye on consumer trends and demand patterns in the UK and Europe. Doing so can help you spot upcoming opportunities.
Technical analysis
Technical analysis can offer insights into the behaviour of the FTSE 100 Index. If you have access to a price chart and charting tools, you can draw up some technical indicators to help you interpret the price action of the FTSE and make informed trading decisions.
Line of Resistance/Support
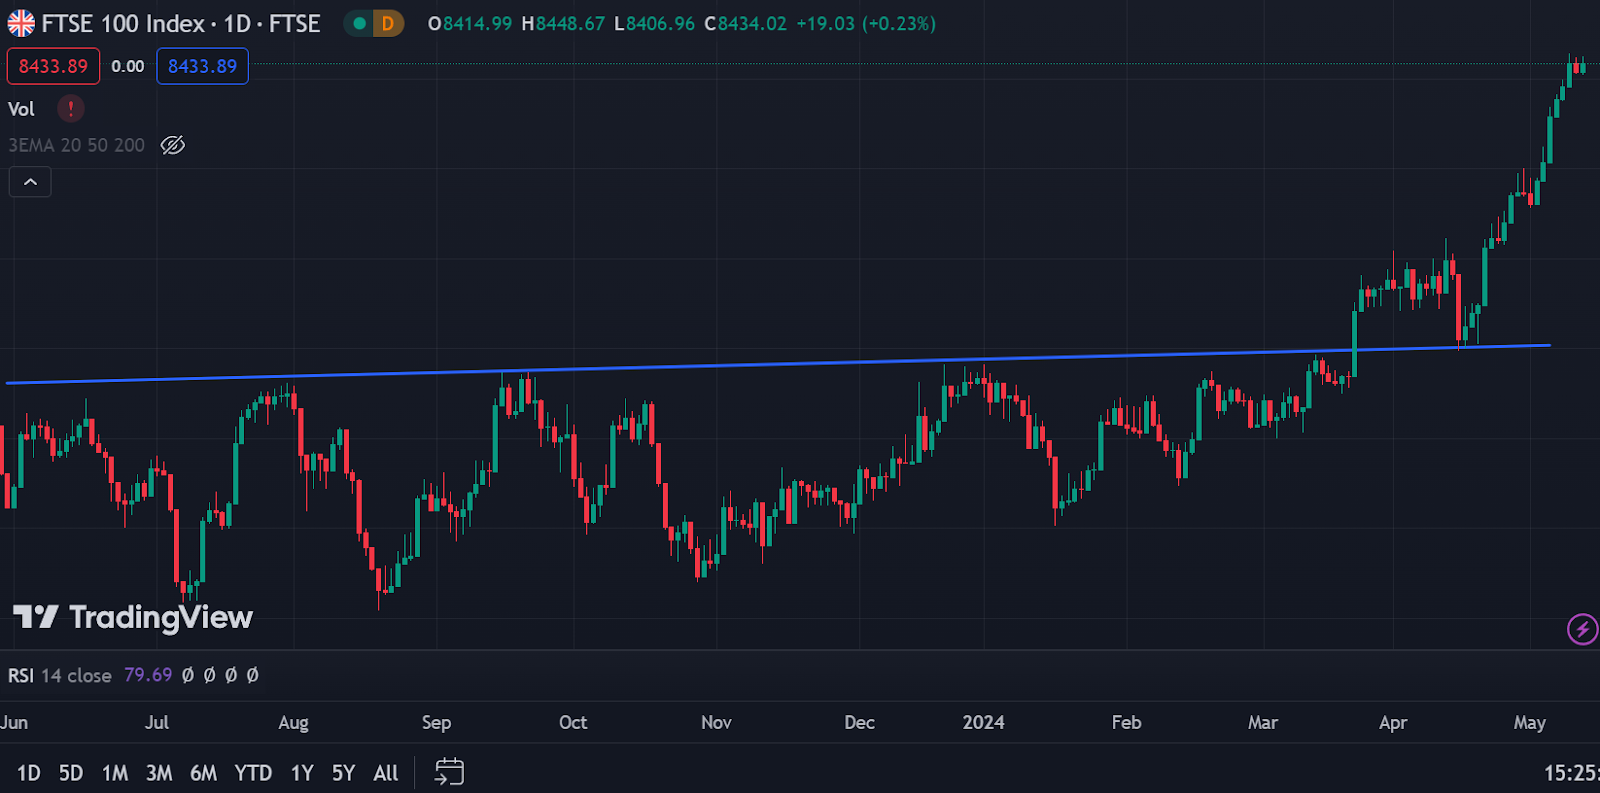
The screenshot above shows the price chart of the FTSE 100 index over the last 12 months. The blue line is a Line of Resistance/Support, which is a popular technical indicator that can help you spot trend reversals.
Going from left to right, notice how the FTSE was consistently below the blue line until around end-March. During this period, the blue line acts as a Line of Resistance, which demarcates the upper limit of price action.
On the left, you can see the FTSE approaching the Line of Resistance two times, but fell back down each time. This can be read as a signal that the index would continue to stay below this price level.
And indeed, this was the case as the FTSE went on to touch – but did not breach – the blue line three more times, with prices falling back down each time.
However, around end-May, the FTSE suddenly shot up, indicated by that large green candle that broke through the Line of Resistance. The index then fell back to the previous high once, touching the blue line – now becoming a Line of Support – before mounting a rally to new highs.
Generally, the more times the price falls back to the Line of Support (aka “retesting the support”) the stronger the possibility of an uptrend. Traders know to wait for two or more retests to confirm an uptrend.
However, in this case, the FTSE tested the Line of Support only once before taking off.
Relative Strength Index (RSI)
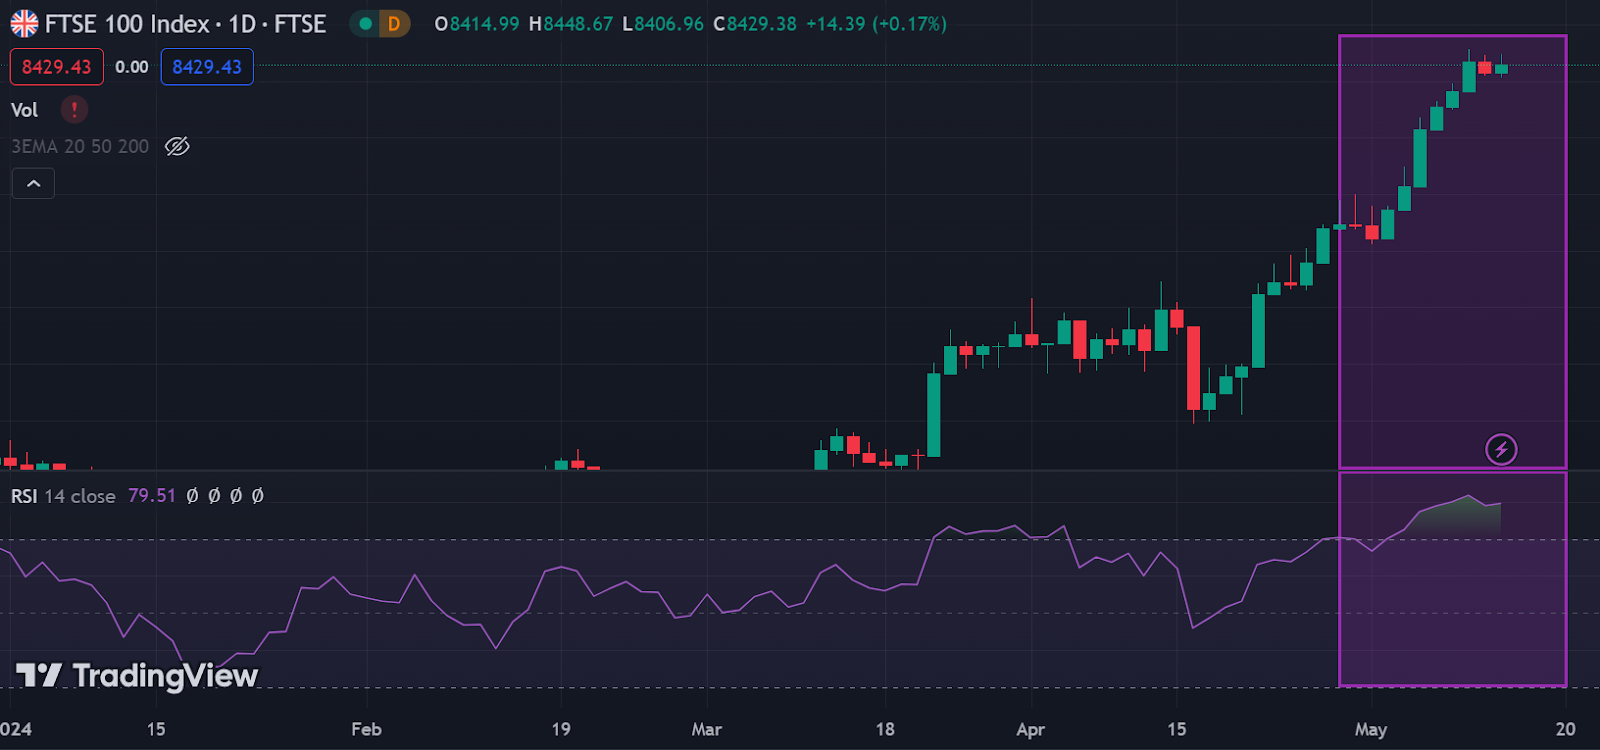
Here’s the FTSE price chart again, zoomed in to the recent few months.
From the previous screenshot, we see that the FTSE has taken off on a significant rally. What we want to know is whether there is sufficient market momentum for the rally to continue.
For that, we can use the Relative Strength Index (RSI), shown in the bottom half of the screenshot, to give us a clue.
The RSI is a momentum-based oscillator used to measure the velocity and magnitude of directional price movements – or, the strength or weakness of a market. It operates between a scale of 0 and 100, with 0 indicating minimal momentum and 100 indicating maximum strength.
When the RSI is at 70 or above, this indicates the index is overbought, indicating a selling opportunity. Conversely, when the RSI is 30 or below, the index is oversold, meaning the current price is a good price to buy.
In the purple-shaded boxes, we see that the RSI is in overbought territory, corresponding with the current highs in the price chart. This could be a good time to sell the index for some quick profits before the rally continues.
You can consult our other guides for detailed explanations on technical indicators and technical analysis. It’s crucial to understand that these are merely tools that help us form an informed opinion on the state of the market. No indicator is 100% accurate, nor is there any that can predict which way the index will go.
Understanding FTSE 100 market factors
Investors wishing to trade the UK’s leading market benchmark should first understand what factors affect the FTSE 100. Broadly, there are four areas to consider.
Economic factors
As mentioned in the section discussing fundamental analysis, investors should pay attention to economic factors such as GDP figures, inflation and exchange rates.
GDP figures are an important indicator of economic growth, which impacts the FTSE directly. Poor GDP numbers may prompt a market sell-off, lowering the index, while a steady rise in the FTSE 100 level may precede good GDP results.
Inflation is another essential economic factor, as high inflation can reduce corporate profits, driving the FTSE down. As inflation eases, the UK’s central bank may lower interest rates, which can spark off a market rally.
Exchange rates are closely related to inflation, and can also impact the FTSE. When the British Pound becomes too strong, exports will become poorer, causing export-related stocks in the index to fall.
Company performance
The FTSE is affected by the performance of its constituent companies. Poor performance by its top constituents, or across a broad swathe of listed companies, will likely result in lower share prices, which will, in turn bring the FTSE down.
Company news and events can also have effects, positive or negative, especially if they involve large-cap public companies.
Global events
Global events can play a part in shaping the price action of the FTSE. Geopolitical instability such as wars and trade tariffs can interfere with natural market pricing, curtailing profits and lowering market confidence.
Natural disasters could disrupt supply chains, driving up prices of goods and creating inflationary pressures.
Commodity prices
Another important market factor to consider is commodity prices, since a substantial portion of the FTSE is made up of oil and energy companies, as well as those involved in mining and utilities.
Spikes in commodity prices can improve the performance of such companies, creating an uplift in the FTSE.
Trading strategies for the FTSE 100
When trading the FTSE 100, investors can choose from a variety of trading strategies, whether short, medium or long term.
Short-term trading strategies
Day trading
Day trading the FTSE involves multiple short-term trades – each lasting for minutes to hours, but never more than a day. This is to avoid overnight risk, where unexpected news or events throws off your trade.
The idea is to make as many winning trades as possible throughout the day, foregoing large dramatic wins in favour of several smaller ones. This strategy requires discipline and fast decision-making to capitalise on opportunities as they come, while not overtrading or exceeding risk limits.
News trading
News trading and fundamental analysis goes hand–in-hand when trading the FTSE 100. Both hinge on keeping track of relevant news reports and information such as corporate earnings, economic reports, consumer trends etc.
As a trading strategy, news trading can be considered to be more relaxed, as traders need only trade when there is important news or developments coming up. Making use of an economic calendar can prove helpful to news traders.
Mid-term trading strategies
Swing trading
Swing trading is a popular trading strategy that aims to capture potential returns from price swings that naturally form in the FTSE.
A swing is identified as an instance when the price changes direction from up to down, or down to up. This can occur over short time frames over hours or in a day, or longer ones over weeks or months. As such, swing trading is suitable for traders who prefer medium-term strategies.
The challenge in swing trading is accurately identifying upcoming swings and then placing appropriate trades to capitalise on them. Longer swings can potentially generate larger profits, but also heightens the risk of getting caught in a trend reversal. Setting reasonable profit targets can be helpful.
Long-term trading strategies
Long-term trading strategies that last several months or years can also pay off well when trading the FTSE. For example, the current price rally would make for a nice reward for investors who maintained their faith in the index.
As a national index that tracks the top performing publicly listed companies, the FTSE has good long-term potential. That’s because you’re essentially investing in the UK economy, and not in individual companies.
However, as the FTSE cannot be owned directly, investors will require index funds to carry out their long-term strategies,
Some popular FTSE index funds include:
- iShares Core FTSE 100 UCITS ETF
- Vanguard FTSE 100 UCITS ETF
- HSBC FTSE 100 UCITS ETF
- UBS FTSE 100 UCITS ETF
As with any investment fund, don’t neglect to check the expense ratio, which is a fee charged by the fund managers for managing the fund. Index ETFs have some of the lowest expense ratios, but these can eat into your returns over the long run.
Risk management strategies when trading FTSE 100
While the FTSE is a highly liquid and well-traded market index, proper risk management should still be implemented. Here are some tips to bear in mind [8].
Set proper trade sizes
The size of each trade should be limited to under 2% of your total capital to prevent your account from taking substantial losses from a few bad trades. This is instrumental in preventing your investment capital from being abruptly wiped out.
Make use of stop-loss and take-profit
Proper use of stop-losses and take-profits can help you prevent overtrading, or holding on to a trade longer than you should.
Set a stop-loss point to cut your losses and preserve your remaining capital for the next trade. One suitable point to set a stop-loss is when the index falls below a key support level.
Meanwhile, use a take-profit point to avoid losing profit due to greed. A winning trade may tempt you to keep the trade open in the hopes of capturing more profit. But in doing so, you’ll risk having the price move against you and wipe out your gains.
For instance, watch out for when the index approaches a key resistance level after a large move upwards. This may be a good time to sell and take profit, before consolidation takes place.
Use leverage with caution
As mentioned earlier, leverage will amplify both your profits and your losses. This means that reckless use of leverage is highly risky and can inflict losses that exceed your capital, putting your account in the negative.
Have a trading plan in place
Above all, understand that trading requires a highly disciplined approach. Trading should be approached with discipline and logic, and the lack of clear guidelines is likely to lead to failure.
Formulate a detailed trading plan that spells out your goals and objectives, strategies you will use, appetite for risk, and your maximum budget available for trading each week or month.
These factors will form the basis of your trading plan, helping you to develop the discipline and habits required for long term success.
Conclusion: Trade the FTSE 100 with Vantage via CFDs
Trade the FTSE 100 with Vantage CFDs to potentially benefit from the vibrant UK stock market without direct ownership of underlying fund units or company shares. Benefit from tight spreads and low cost – starting from $0 per trade.
Explore opportunities to generate potential returns across diverse market conditions, with the choice to open long or short positions, and control risk with tools such as negative balance protection, price alerts and stop losses. With real time new alerts on our mobile app and trading platform, you get the power and flexibility to react quickly to market developments, and trade on the go.
Sign up for a live account and experience the Vantage advantage today.
References
- “Footsie (FTSE): What it Means and How it Works – Investopedia”. https://www.investopedia.com/terms/f/footsie.asp. Accessed 17 May 2024.
- “FTSE 100 – London Stock Exchange”. https://www.londonstockexchange.com/indices/ftse-100/constituents/table. Accessed 17 May 2024.
- “LSE Trading Hours & Market Holidays – TradingHours.com”. https://www.tradinghours.com/markets/lse. Accessed 17 May 2024.
- “If the UK stock market is cheap, why doesn’t it go up? – Financial Times”. https://www.ft.com/content/726a6188-f04c-40e4-b7d1-a055d75e772c. Accessed 17 May 2024.
- “Historical performance of the FTSE 100 index – Curvo”. https://curvo.eu/backtest/en/market-index/ftse-100?currency=eur. Accessed 17 May 2024.
- “Stocks fall to end Wall Street’s worst year since 2008, S&P 500 finishes 2022 down nearly 20% – CNBC”. https://www.cnbc.com/2022/12/29/stock-market-futures-open-to-close-news.html. Accessed 17 May 2024.
- “UK’s FTSE 100 hits record high as favourable data boosts sentiment – Reuters”. https://www.reuters.com/markets/europe/anglo-american-boosts-londons-ftse-100-near-record-high-2024-05-03/. Accessed 17 May 2024.
- “Risk Management Techniques for Active Traders – Investopedia”. https://www.investopedia.com/articles/trading/09/risk-management.asp. Accessed 17 May 2024.


